 If you are involved in design or editorial projects related to content marketing or public relations, then you are well aware that infographics have quickly become a wildly popular form of communications. According to Google, searches for infographics have increased 800 percent in the last two years. Infographics give marketers a way to increase brand recognition, create buzz, and improve SEO.
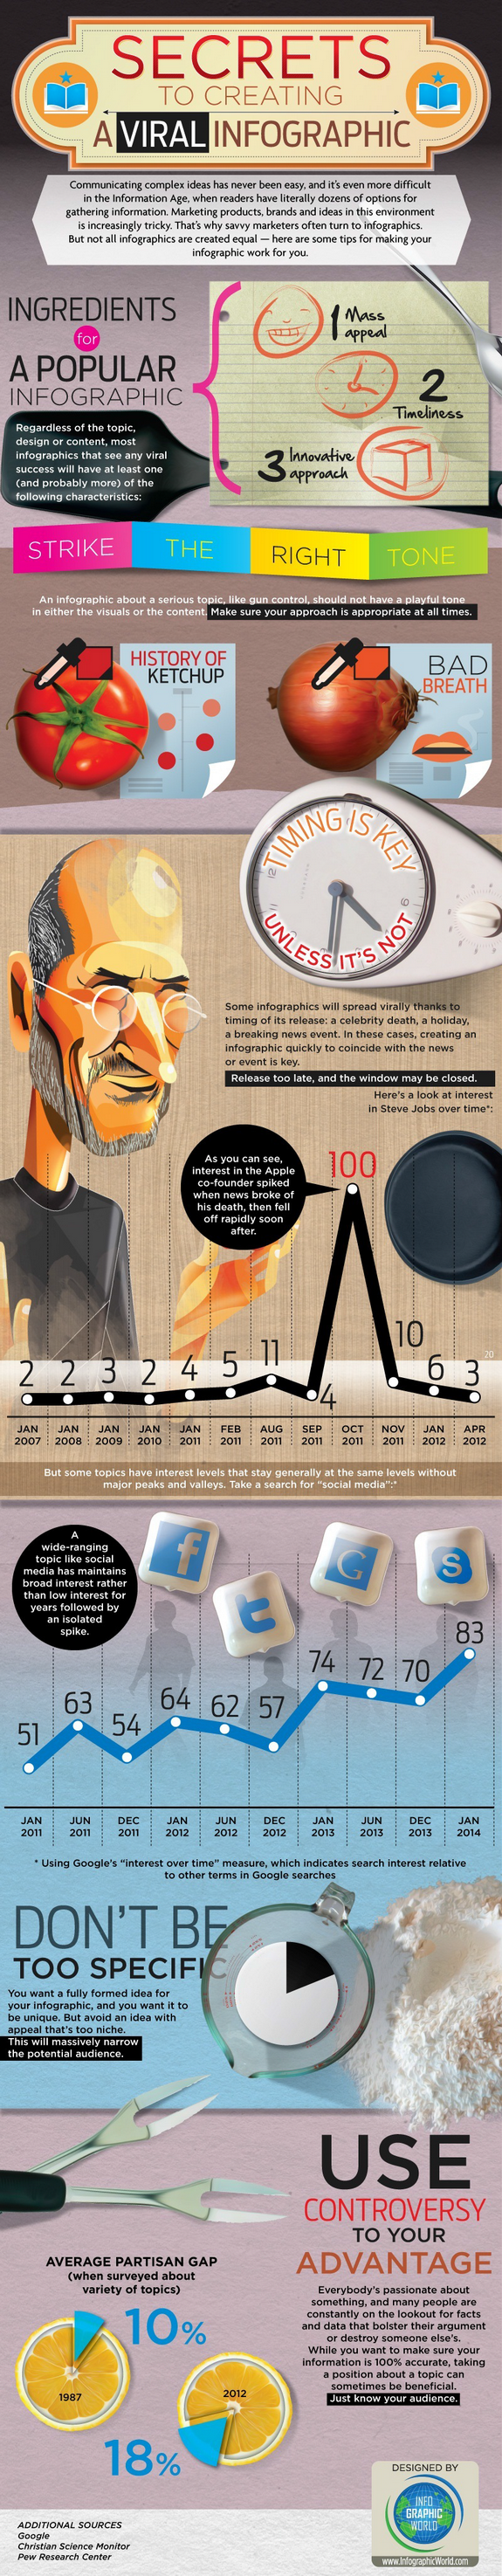
Justin Beegel, CEO of Infographic World and the author of the new book “Infographics For Dummies,” offers five tips for creating an infographic that will go viral and global.
1. Identify Ideas That Have Legs
To create an infographic campaign that has mass appeal, be timely and innovative. If there is a hot topic in the news, capitalize on it. Take it to the next step or give it a new angle. Avoid ideas that are too niche and, if possible, walk a fine line between what is controversial and what is acceptable. That will help it go viral, as controversy sells.
2. Be Able to Mobilize Quickly
Another important component is the ability to mobilize your team quickly. A few years ago I saw a map of the U.S. that listed stereotypes of the people from that state. The infographic was called “How Europeans View America.” We saw this as an opportunity, so our team quickly put together a map of Europe and called it “How Americans View Europe.” We went country by country and made our own stereotypes. The graphic spread like wildfire, and actually crashed our server for an hour from too much web traffic. We received some angry emails from people in Europe, but the graphic served its purpose, was all in good fun, and was a living example of viral content. Another example of a successful and timely campaigns featured a look into the life of Steve Jobs shortly following his death. We also did one on the business of running for president around the 2012 presidential elections.
3. Use the Appropriate Tone
B2B marketers should consider their industry and use the tone appropriate for the audience. We have done campaigns across the spectrum from major hospitals such as Mount Sanai to entertainment properties such as ESPN. Topics have ranged from Breast Cancer Awareness Month to the Super Bowl. For a serious topic, you may not want silly cartoon-like characters, but for the light-hearted topics you can have a little more fun.
4. Sync-up Distribution Tactics
Once the infographic is completed, coordinate promotional efforts with all stakeholders. The graphic should go live on all parties’ websites and across all their social media platforms to give it the widest possible launching pad for exposure. My company has a promotional and PR division with extensive media contacts so we can maximize coverage by distributing the infographic to relevant media.
5. Consider Going Interactive
Adults are grown children and enjoy playing with things. By making your infographic interactive, readers can click on various parts of the infographic to get more information. For example, we recently did a great interactive infographic on crime in America. If you click on each state, you can see where that state ranks in various categories such as theft, violent crimes, murder, etc. By going interactive, you are likely to get more shares and backlinks, which will drive your business.
About Justin Beegel
Justin is the 28-year-old founder of Infographic World, a leading information graphics company based in New York City. The company, which launched in 2009, is projected to make $2 million in revenue in 2014. Infographic World’s clients include Google, Intel, ESPN, P&G, Discovery, McGraw Hill, Pepsi, Intuit, and McCann.
About “Infographics for Dummies”
“Infographics For Dummies” is a comprehensive guide to creating data visualization with viral appeal. The book walks you through the different types of infographics and explains why they’re so effective and when they’re appropriate. The guide also includes step-by-step instruction for creating eye-catching graphics with programs such as Adobe Illustrator and Photoshop.“Infographics For Dummies” is available nationwide in Barnes and Nobles, Amazon and Wiley.com in both a paperback and e-book formats. The MSRP is $29.99.
LINKS